{{
}}
Faire une présentation scientifique
Joseph Salmon
- Sources d’inspiration pour cette présentation:
Quelques exemples de présentations scientifiques:
- Gabriel Peyré: excellentes diapositives ! (mathématiques appliquées)
- Persi Diaconis (Stanford Univ.) : excellent orateur (randomness)
- Sebastian Wild: sorting excellentes diapositive (algorithmes de tri)
- David Donoho : excellent orateur (statistiques)
- Emmanuel Candès: excellent orateur (statistiques)
- Hannah Fry: excellente oratrice (mathématiques appliquées)
Quatre étapes pour un bon exposé
Étape 1:
Choisir un fil narratif
Étape 2:
Planifiez vos diapositives
Étape 3:
Création des diapositives
Étape 4:
Répéter et ajuster
Étape 1: Choisir un fil narratif
Créez un plan : ne pas oublier de détails importants
Introduction (difficile): perspective large / prépare l’audience à ce qui suivra
- Utiliser une image/video pour capter l’attention
Méthodes : Décrire les méthodes utilisées (crédibilité)
- Utiliser des visuels pour décrire les méthodes
- Inclure assez de détails pour que l’audience comprenne (éviter le superflu)
Résultats : Présenter les preuves soutenant votre travail
- Choisir les résultats les plus importants et intéressants
- Décomposer les résultats complexes en parties digestes
Conclusion & Perspectives
Étape 2: Planifiez vos diapositives
Titres des diapositives : Une idée principale par diapositive
Conception des diapositives :
- Choisir le type: Quarto, Beamer, Impress (éviter PowerPoint, keynote)
- Décider comment transmettre l’idée principale : Figures, photos, équations, statistiques, références, etc.
- Corps de la diapositive : Soutenir l’idée principale
Contenu des diapositives : Lister les points à aborder en bullet points
Étape 3: Création des diapositives
- Format des diapositives :
- Diapositive de titre : Informative, inclure noms et une image attrayante
- Mise en page : Simple, beaucoup d’espace vide, ne pas surcharger
- Éléments textuels :
- Texte concis : Éviter phrases complètes, pas plus de 10-12 lignes / diapositive
- Relecture : orthographe / grammaire
- Citations et crédit: Inclure les sources
- Graphiques /Figures (mieux qu’un tableau)
- Adapter pour la présentation, éviter détails trop petits
- Couleurs : Utiliser de manière significative (attention aux daltoniens!)
- Inkscape : Pour les figures / croquis
- Transitions & animations : transitions entre sections, éviter les distractions
Étape 4: Répéter et ajuster
- Première répétition :
- Seul : Vérifiez la fluidité de votre narration
- Points à vérifier : Début et fin, transitions, animations, aide des diapositives
- Pratique devant un public :
- Devant des pairs : Chronométrer le discours
- Feedback : Noter les retours et les questions posées
- Intégrer le feedback : Supprimer les points superflues
- Répéter plusieurs fois :
- Mémoriser l’ordre : Connaître les transitions clés
- Ne pas apprendre par cœur : sauf l’ouverture, la clôture et les points clés
- Améliorer la présentation :
- Intonation et vitesse : Faire des pauses, regarder l’audience imaginaire
- Respecter le temps imparti : Laisser du temps pour les questions
- Anticiper les questions : Préparer des diapositives supplémentaires
Conseils: mise en page (10 points sur 20)
- Taille de police : Ajuster pour que 10 mots tiennent horizontalement en gros
- Polices : Ne pas utiliser plus de 2 ou 3 polices différentes
- Texte essentiel : Supprimer tout texte superflu
- Acronymes : Rappeler leur signification à chaque fois
- Majuscules : Éviter les titres en majuscules.
- Bannières et logos : Éviter les bannières, logos ou arrière-plans répétés
- Transitions : Éviter les transitions avec effets de fondu, texte rebondissant ou sons (distraction)
- Couleurs : Éviter de mélanger vert et rouge pour les figures (daltonisme).
- Figures >> tables : Utiliser des figures plutôt que des tableaux
- Légendes : Supprimer les légendes automatiques, étiqueter directement le graphique
- Lisibilité : Assurer que les polices et les largeurs de ligne sont lisibles après redimensionnement
- Données 3D : Ne jamais afficher des données 2D en 3D!
Conseils: présentation (10 points sur 20)
- Connexion : connecter votre ordinateur au projecteur (prenez votre propre connecteur si besoin)
- Notes : Éviter de lire, de faire des phrases et blagues pré-écrites
- Pointeur : Utiliser un pointeur ou votre doigt pour orienter l’audience vers des parties spécifiques de la diapositive
- Pointeur sur l’écran : Toucher l’image sur l’écran plutôt que de projeter une ombre avec le pointeur.
- Dynamisme : Parler plus fort et devenir plus dynamique si l’audience commence à fermer les yeux
- Questions : Reformuler les questions à haute voix pour le bénéfice de tous
- Mots parasites : Minimiser l’utilisation de “OK”, “euh”, “ahhh”, “er”, etc.
- Humour : Éviter le plus possible, rester professionnel
Real talk part
Mainly joint work with:
- Tanguy Lefort (Univ. Montpellier, IMAG)
- Benjamin Charlier (Univ. Montpellier, IMAG)
- Camille Garcin (Univ. Montpellier, IMAG)
- Maximilien Servajean (Univ. Paul-Valéry-Montpellier, LIRMM, Univ. Montpellier)
- Alexis Joly (Inria, LIRMM, Univ. Montpellier)
and from
- Pierre Bonnet, Hervé Goëau (CIRAD, AMAP)
- Antoine Affouard, Jean-Christophe Lombardo, Titouan Lorieul, Mathias Chouet (Inria, LIRMM, Univ. Montpellier)
Pl@ntNet description
Pl@ntNet: ML for citizen science
A citizen science platform using machine learning to help people identify plants with their mobile phones

- Website: https://plantnet.org/
- Note: no mushroom identification!
https://identify.plantnet.org/stats
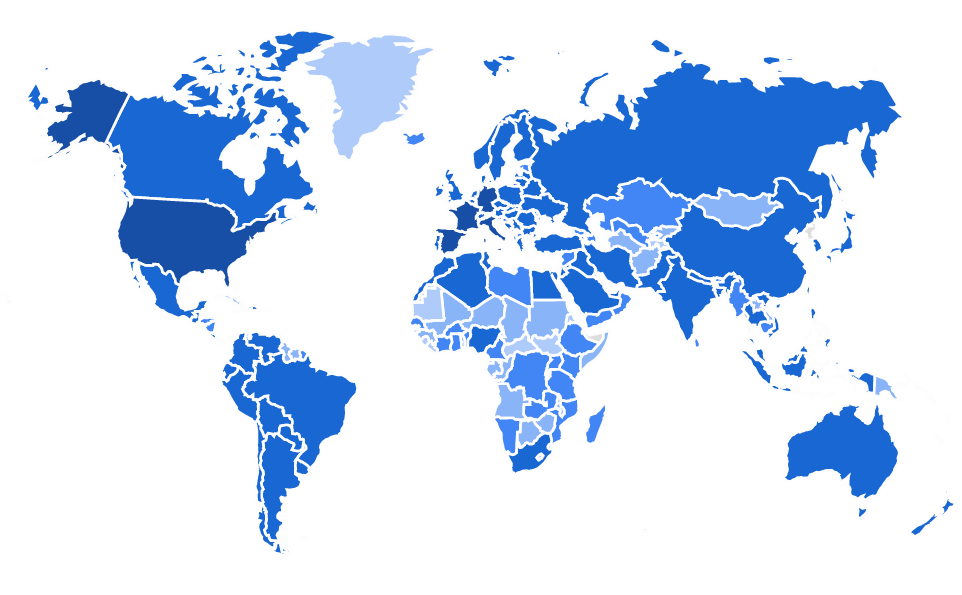
- Start in 2011, now 25M+ users
- 200+ countries
- Up to 2M image uploaded/day
- 50K species
- 1B+ total images
- 10M+ labeled / validated
Pl@ntNet & Cooperative Learning
Note: I am mostly innocent; started working with the Pl@ntNet team in 2020
Motivation: excellent app … but not a perfect app; How to improve?
- Community effort: machine learning, ecology, engineering, amateurs
- Many open problems (theoretical/practical)
- Need for methodological/computational breakthrough
Contributions
- Pl@ntNet-300K (Garcin et al. 2021): Creation and release of a large-scale dataset sharing the same property as Pl@ntNet; available for the community to improve learning systems
- Learning & crowd-sourced data (Lefort et al. 2024) and (Lefort et al. 2025): How to leverage multiple labels per image to improve the model? Need to assert quality: the workers, the images/labels, the model, etc.
- Top-K learning (Garcin et al. 2022): Driven by theory, introduce new loss to cope with Pl@ntNet constraints to output multiple labels (e.g., UX, Deep Learning framework, etc.)
Dataset release: Pl@ntNet-300K
Popular datasets limitations:
- structure of labels too simplistic (CIFAR-10, CIFAR-100)
- might have tasks too easy to discriminate
- might be too well-balanced (same number of images per class)
- contains duplicate, low-quality, or irrelevant images
Motivation:
release a large-scale dataset sharing similar features as the Pl@ntNet dataset to foster research in plant identification
\(\implies\) Pl@ntNet-300K (Garcin et al. 2021)
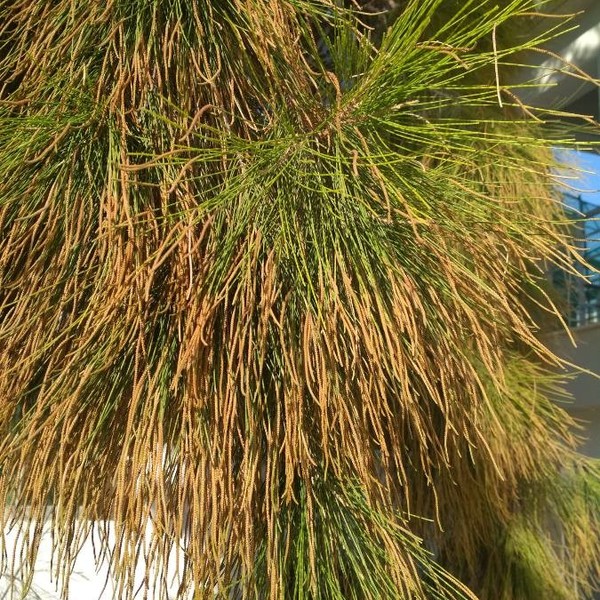
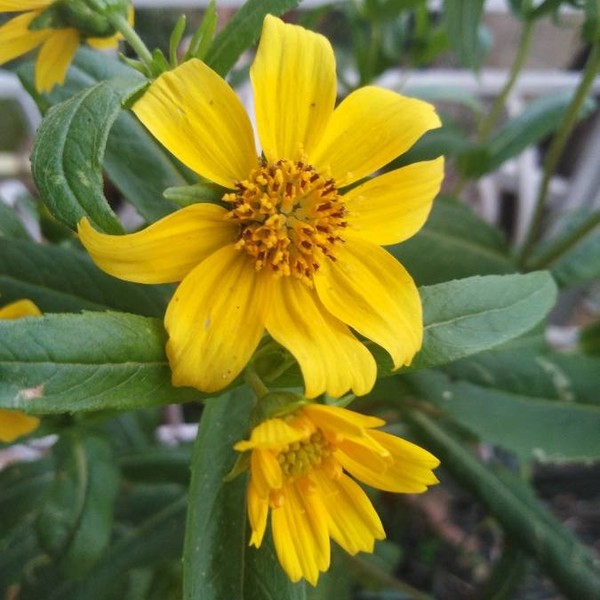
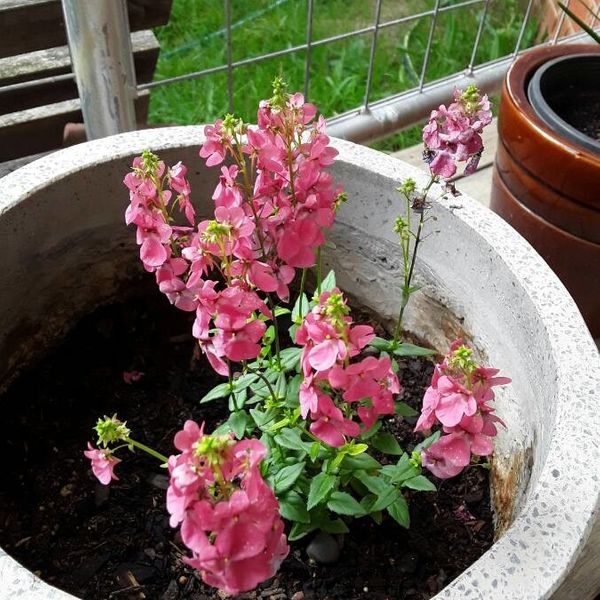
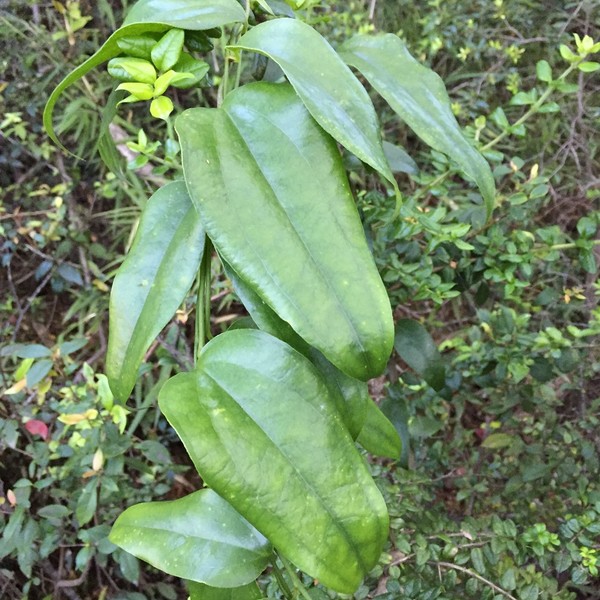
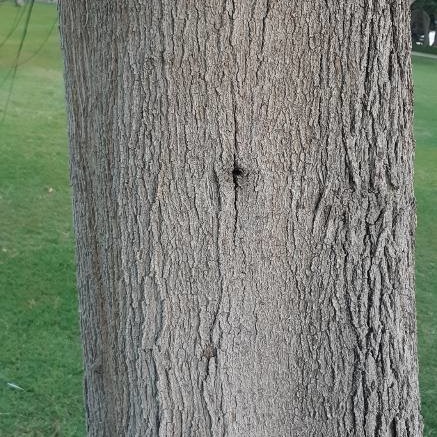
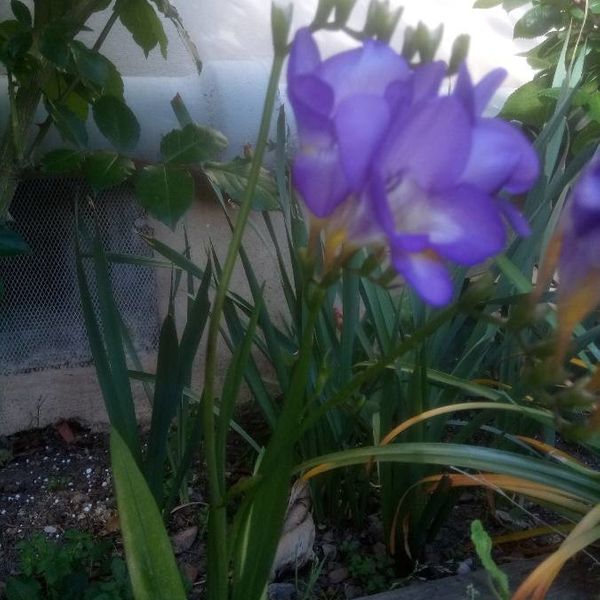
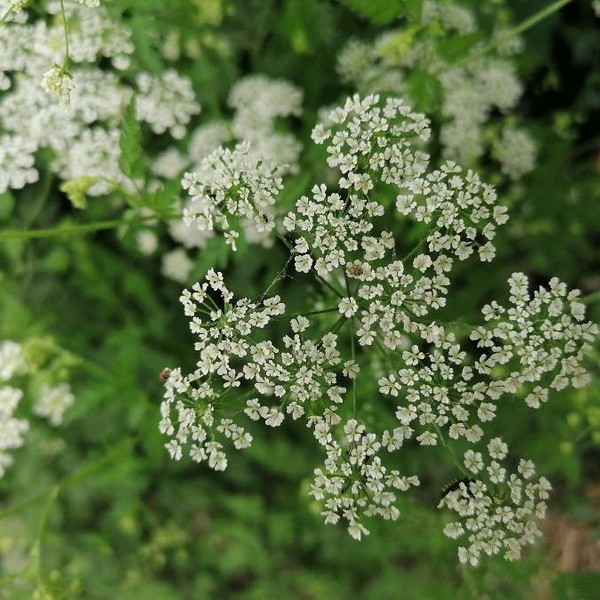
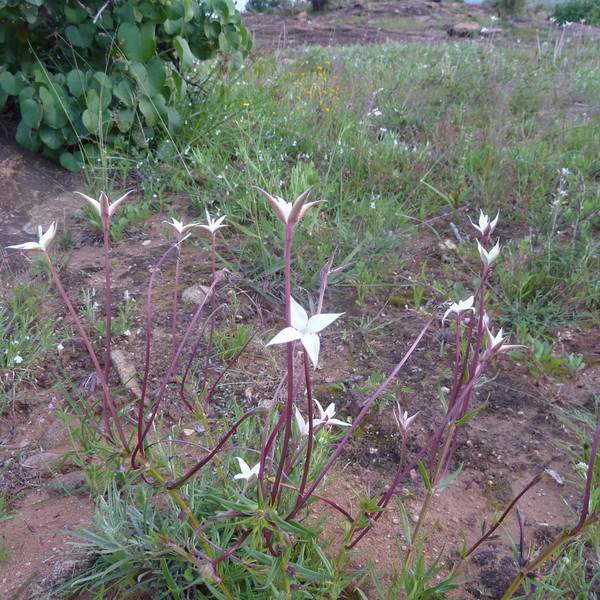
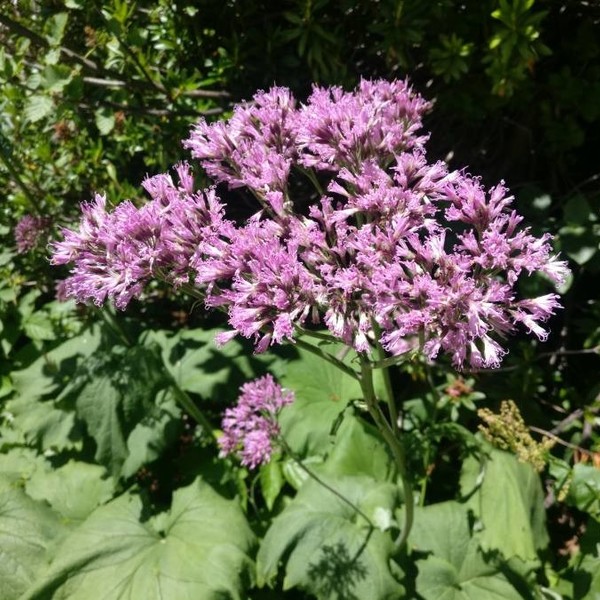
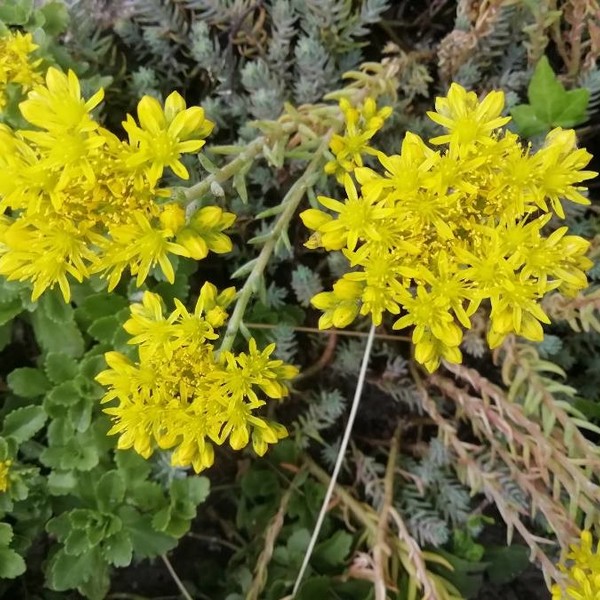
Intra-class variability
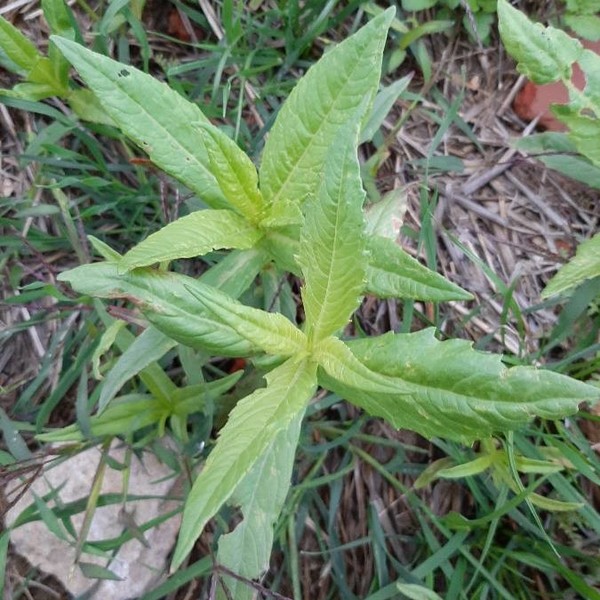
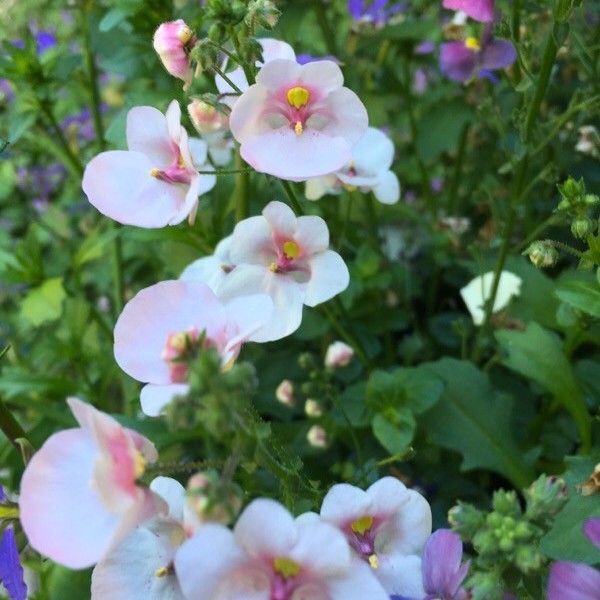
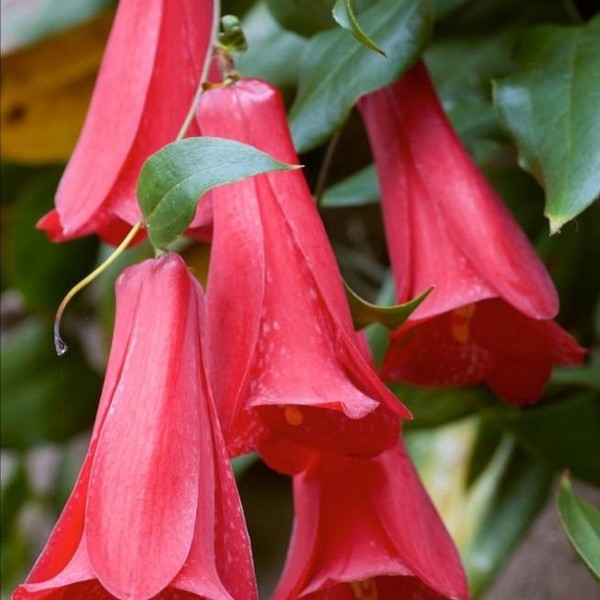

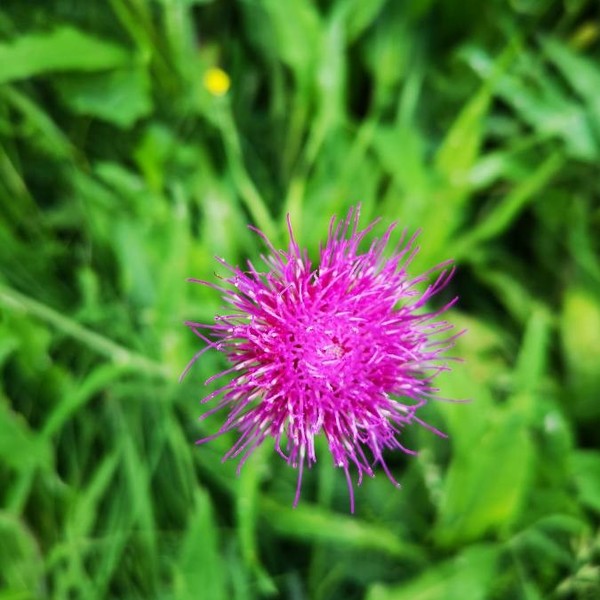
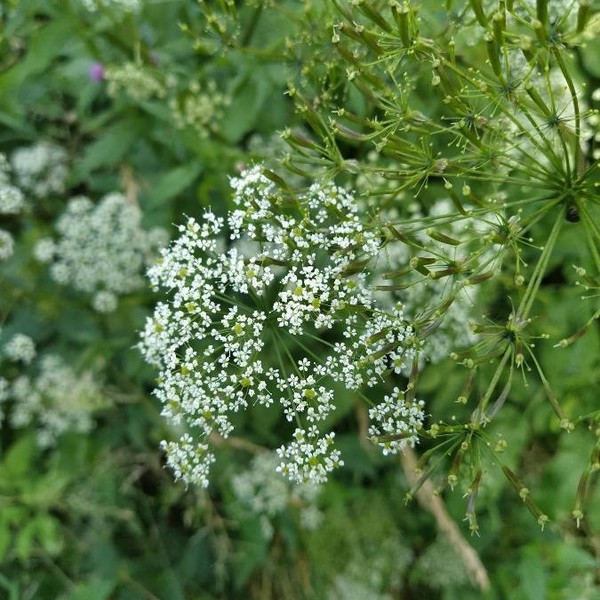
Inter-class ambiguity
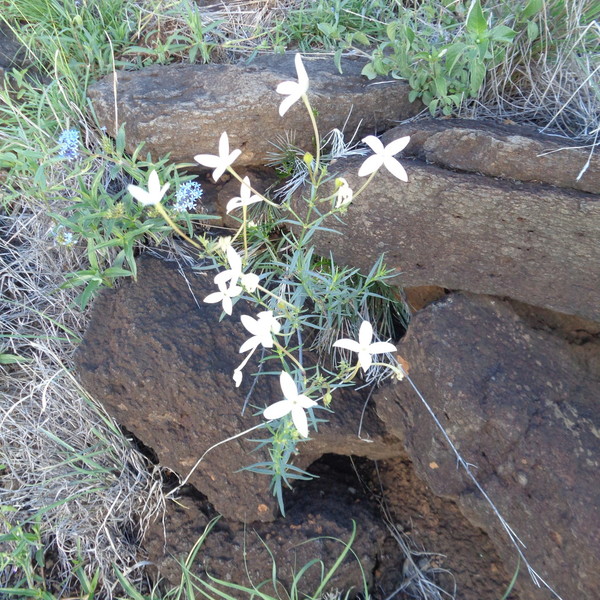
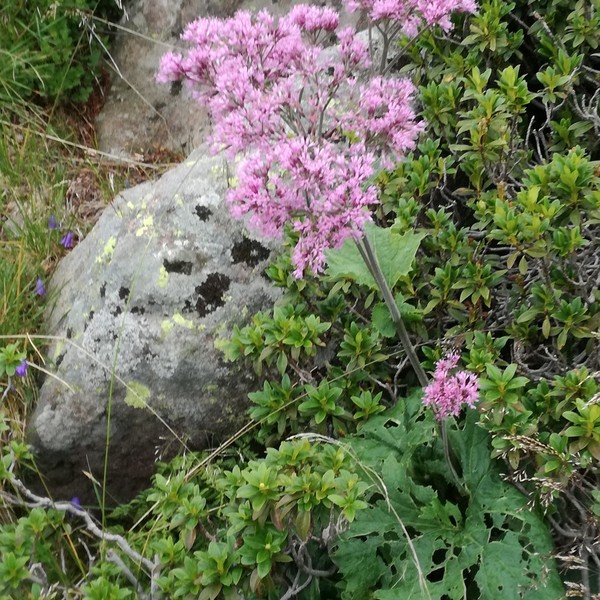
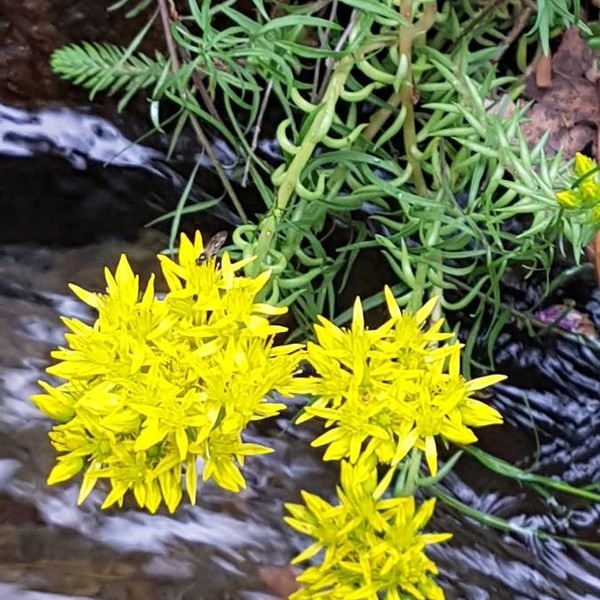
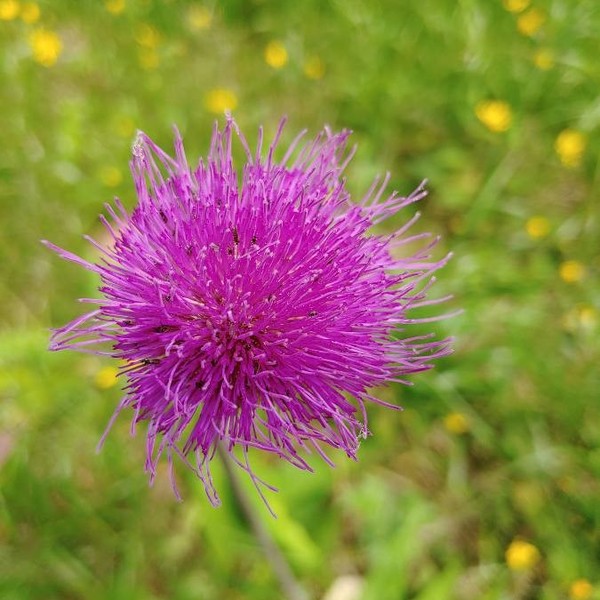
Sampling bias
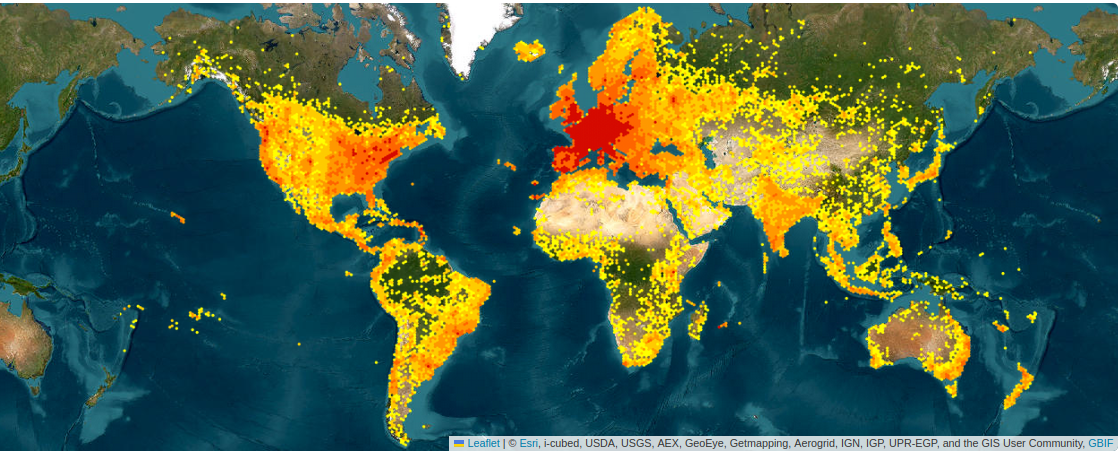
Top-5 most observed plant species in Pl@ntNet (13/04/2024):
25134 obs. 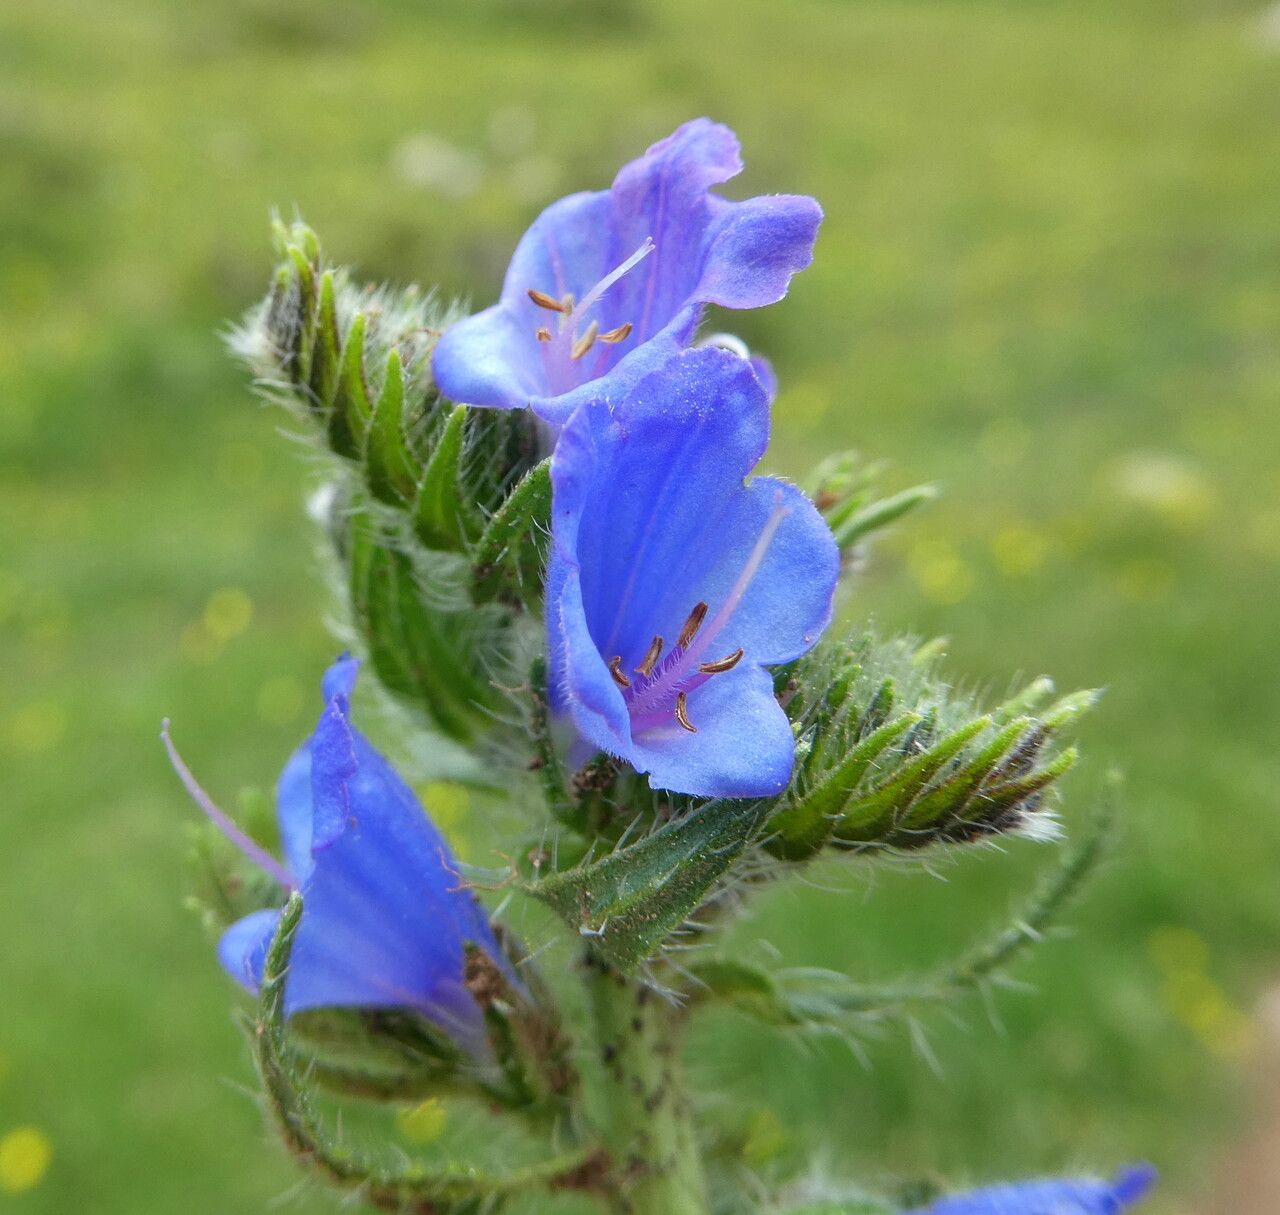 Echium vulgare L.
24720 obs. 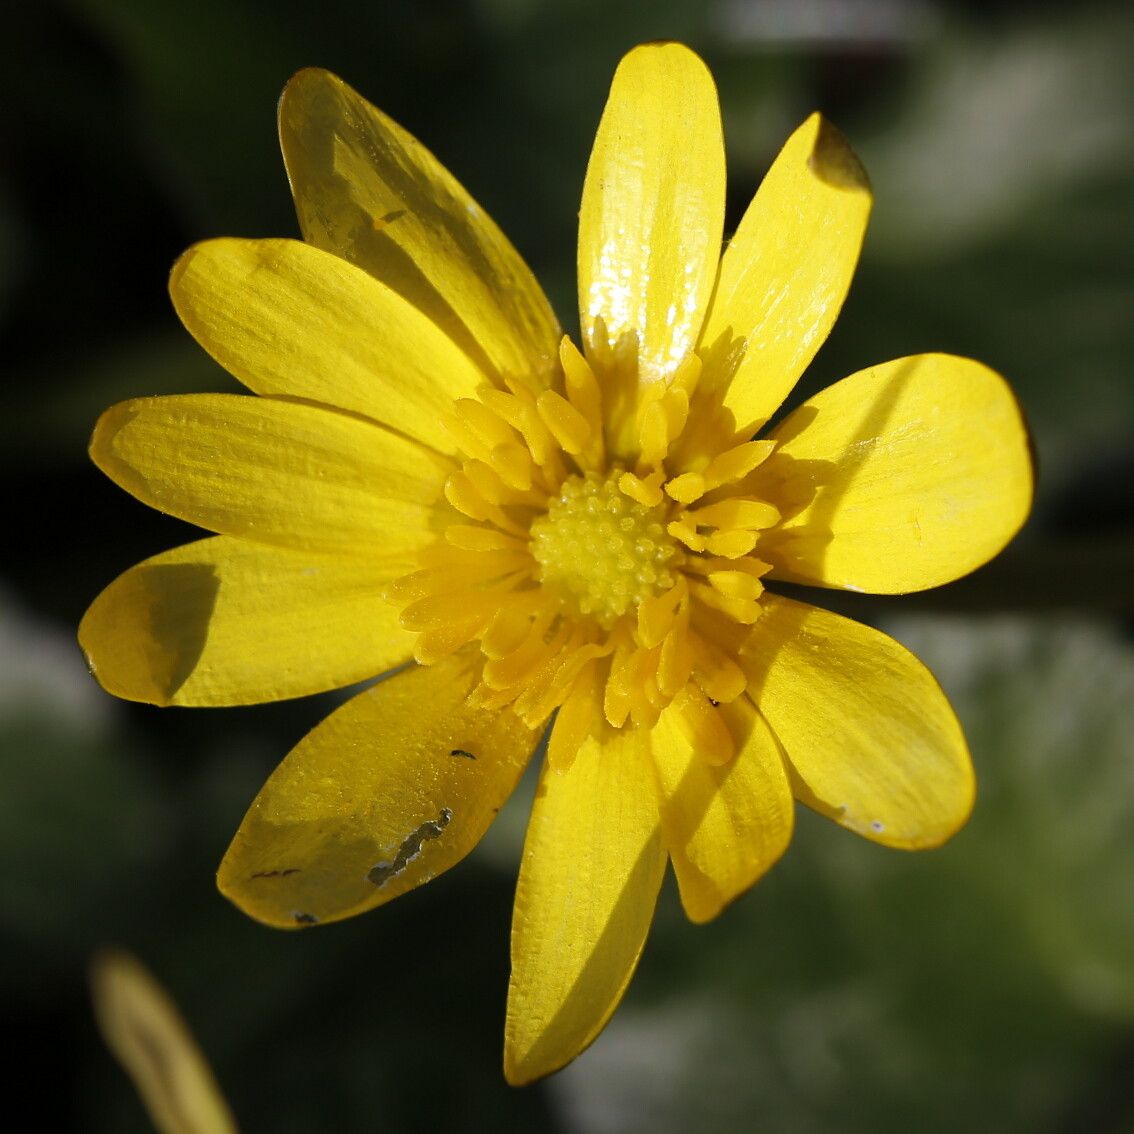 Ranunculus ficaria L.
24103 obs. 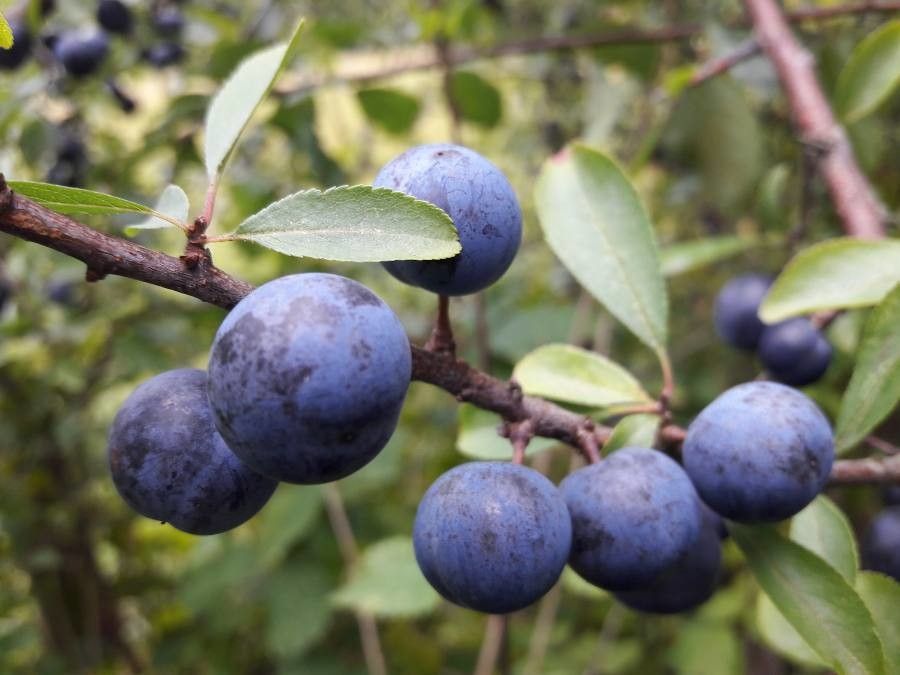 Prunus spinosa L.
23288 obs. 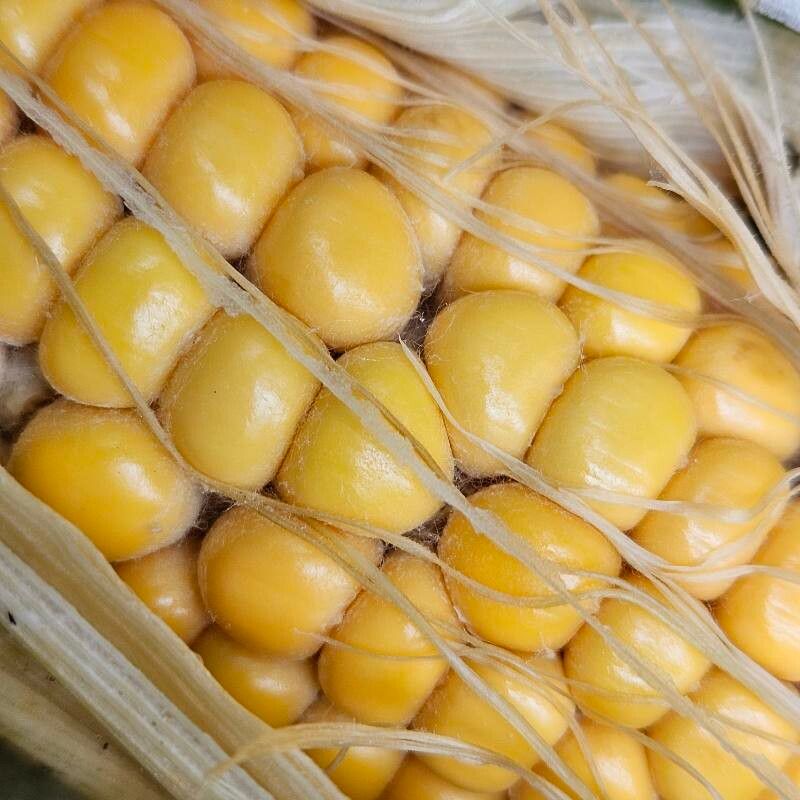 Zea mays L.
23075 obs. 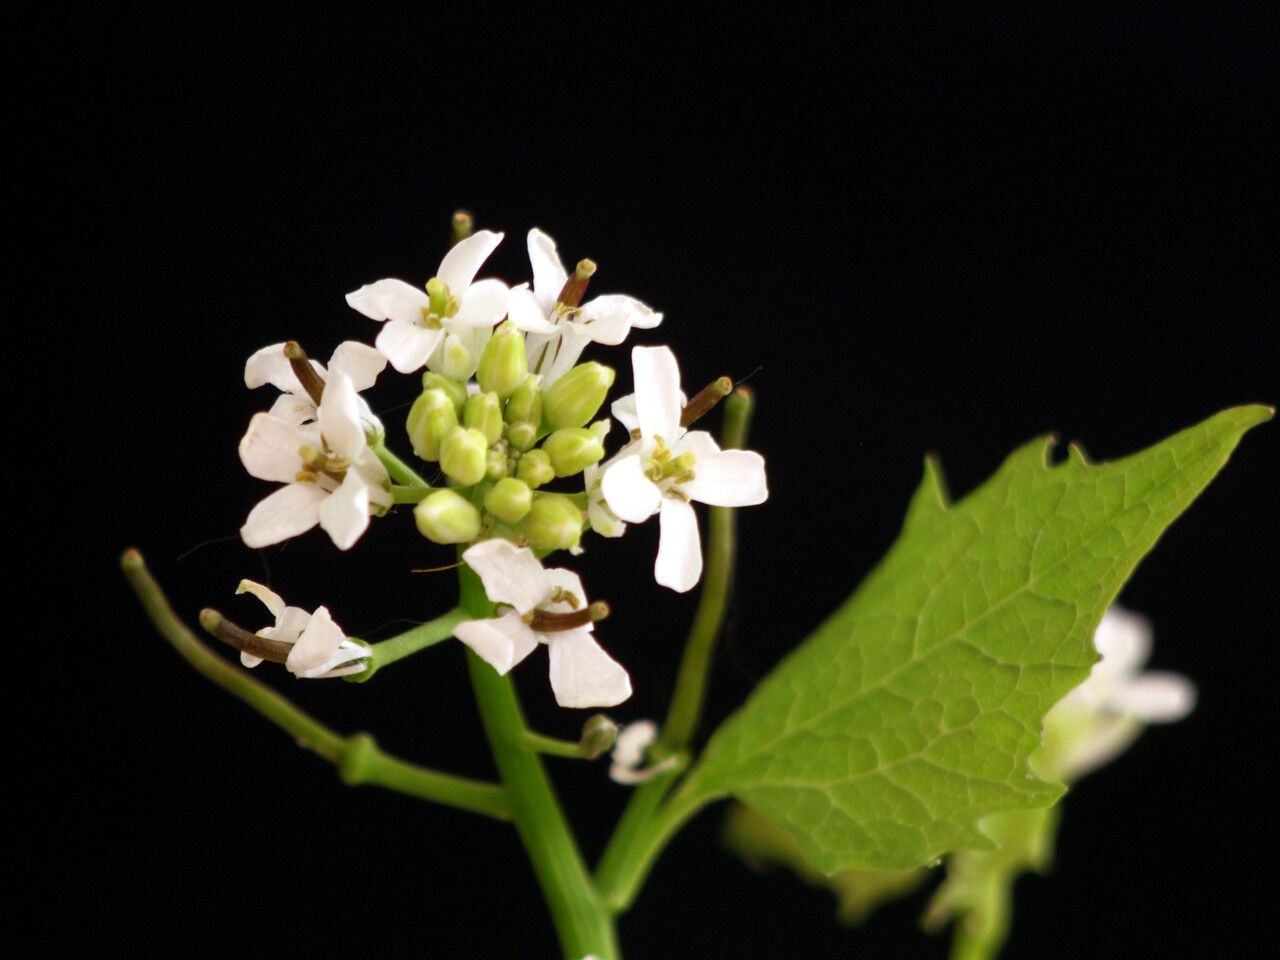 Alliaria petiolata
10753 obs.
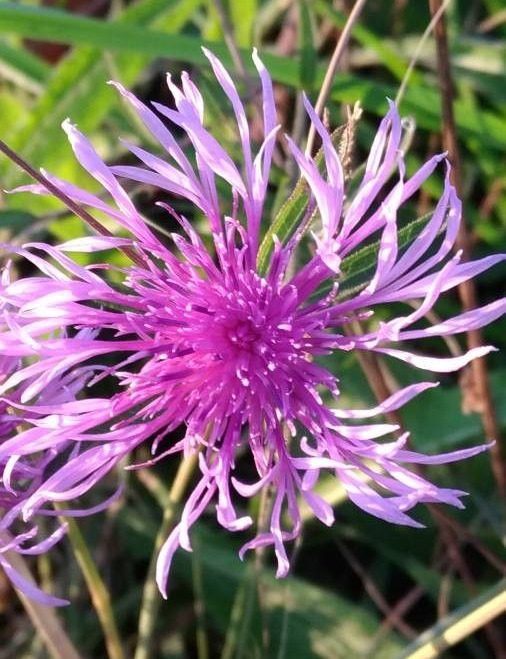
Centaurea jacea
6 obs.
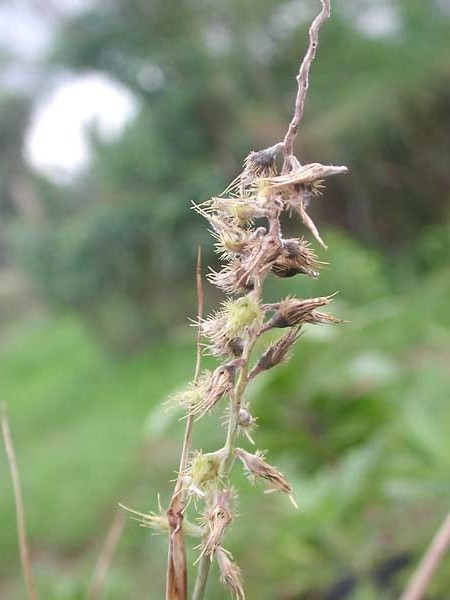
Cenchrus agrimonioides
8376 obs.
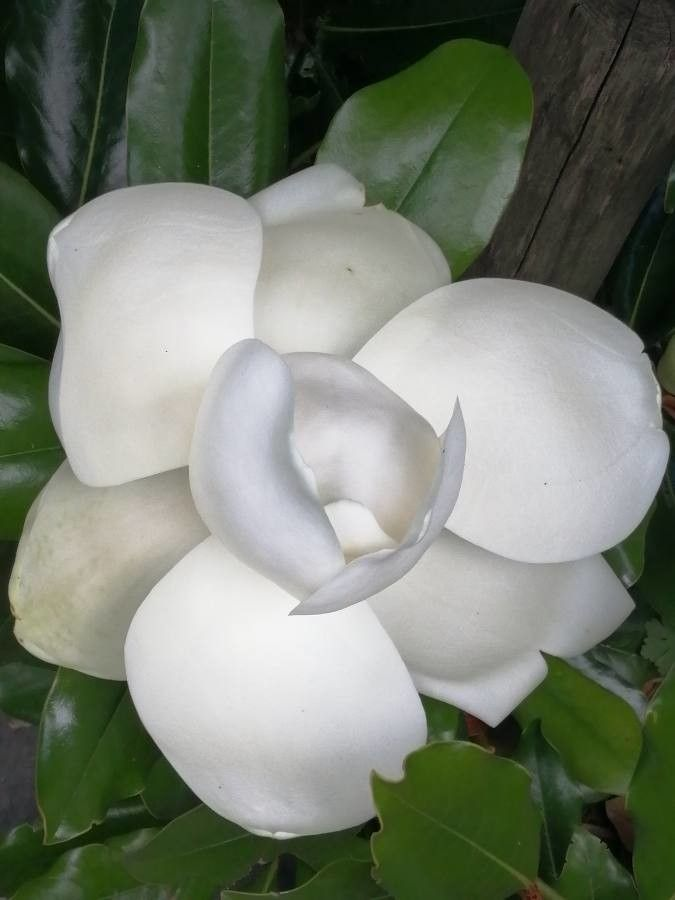
Magnolia grandiflora

413 obs.
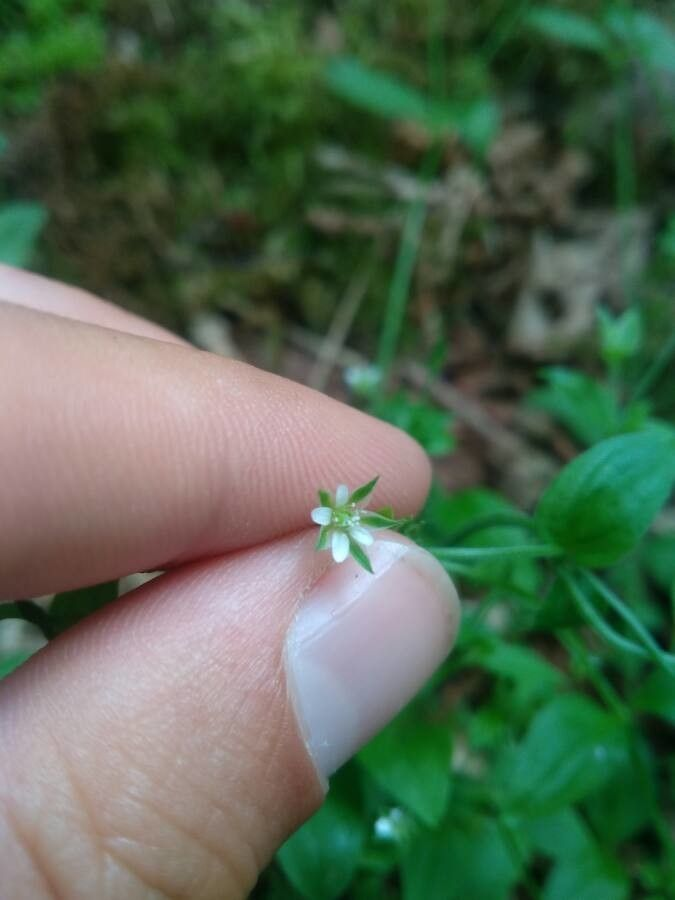
Moehringia trinervia
Many more biases …
- Selection bias
- Convenience sampling: easily vs. hardly accessible
- Preference for certain species: visibility / ease of identification
- Subjective bias: selection based on personal judgment, may not be random or representative
- Rare species: rare or endangered species may be under-represented
- Temporal bias / seasonal variation: seasonal changes in plant characteristics
- …
Construction of Pl@ntNet-300K
- Earth: 300K+ species
- Pl@ntNet: 50K+ species
- Pl@ntNet-300K: 1K+ species
Note: long tail preserved by genera subsampling
Caracteristics:
- 306,146 color images
- Size : 32 GB
- Labels: K=1,081 species
- Required 2,079,003 volunteers “workers”
Zenodo, 1 click download
https://zenodo.org/record/5645731
Code to train models
https://github.com/plantnet/PlantNet-300KVotes, labels & aggregation
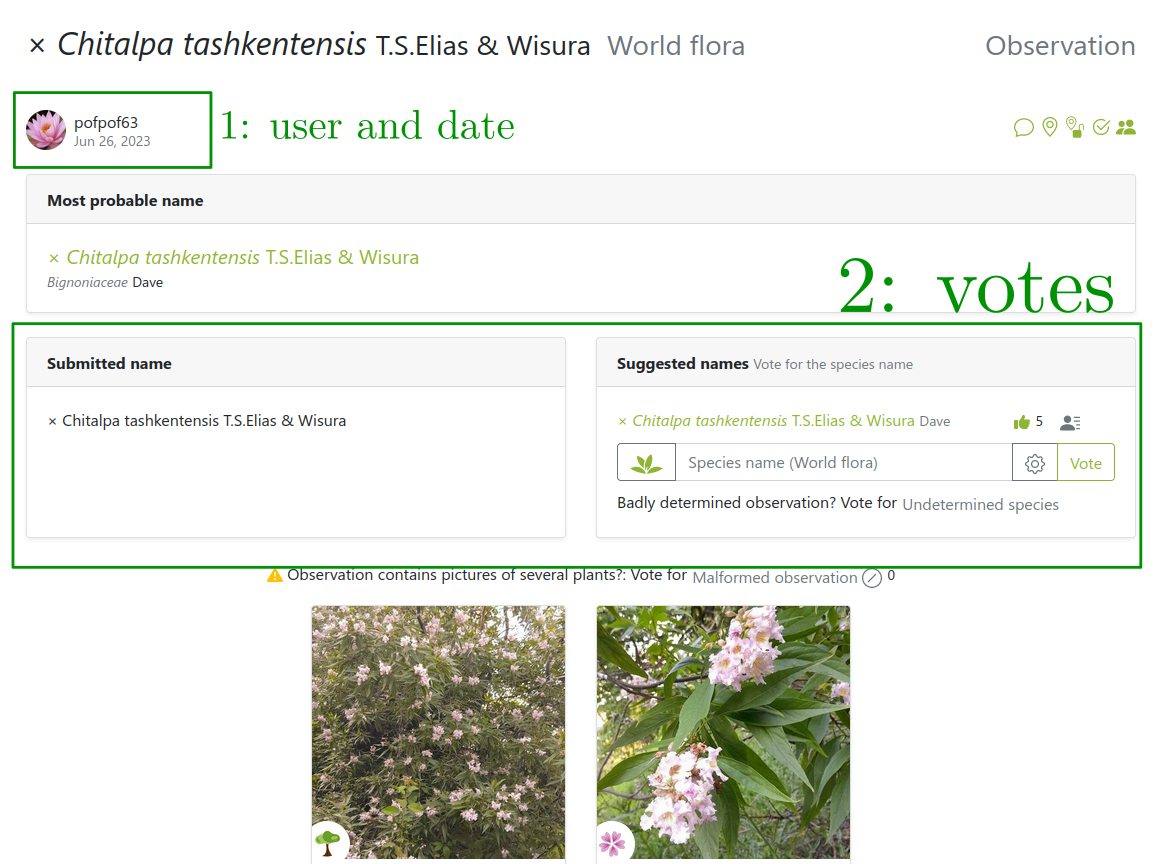
Images from users… so are the labels!
But users can be wrong or not experts
Several labels can be available per image!
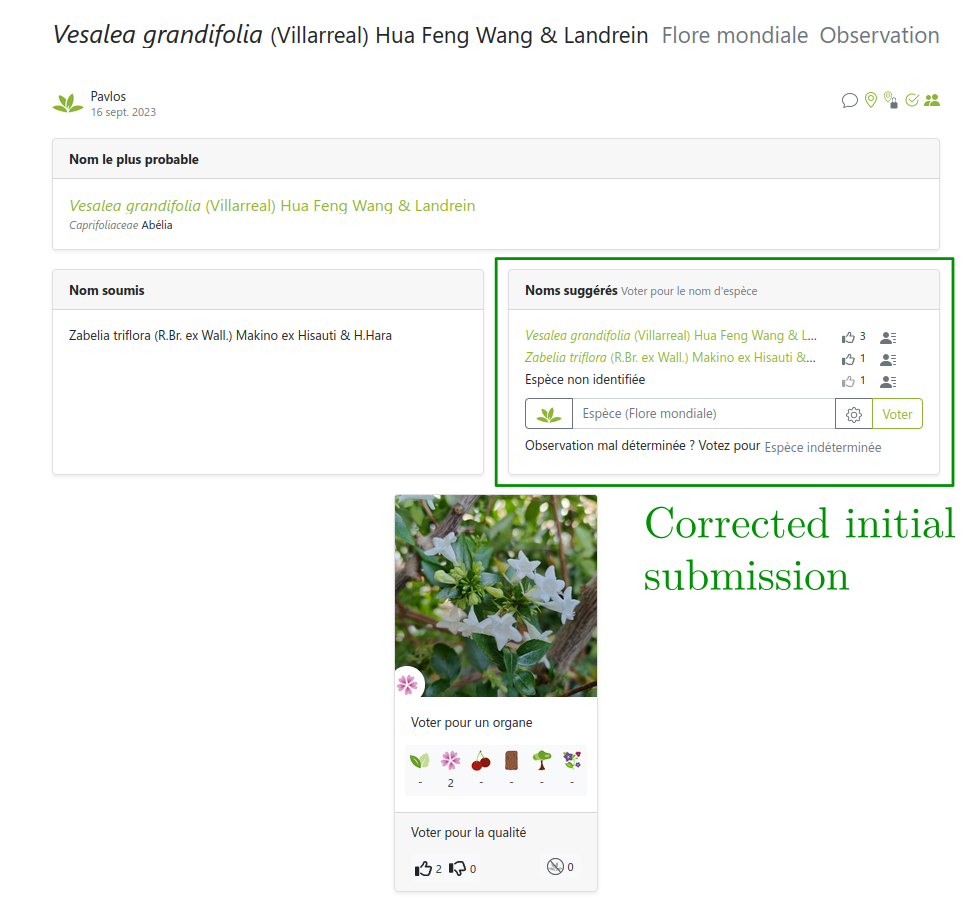
But sometimes users can’t be trusted
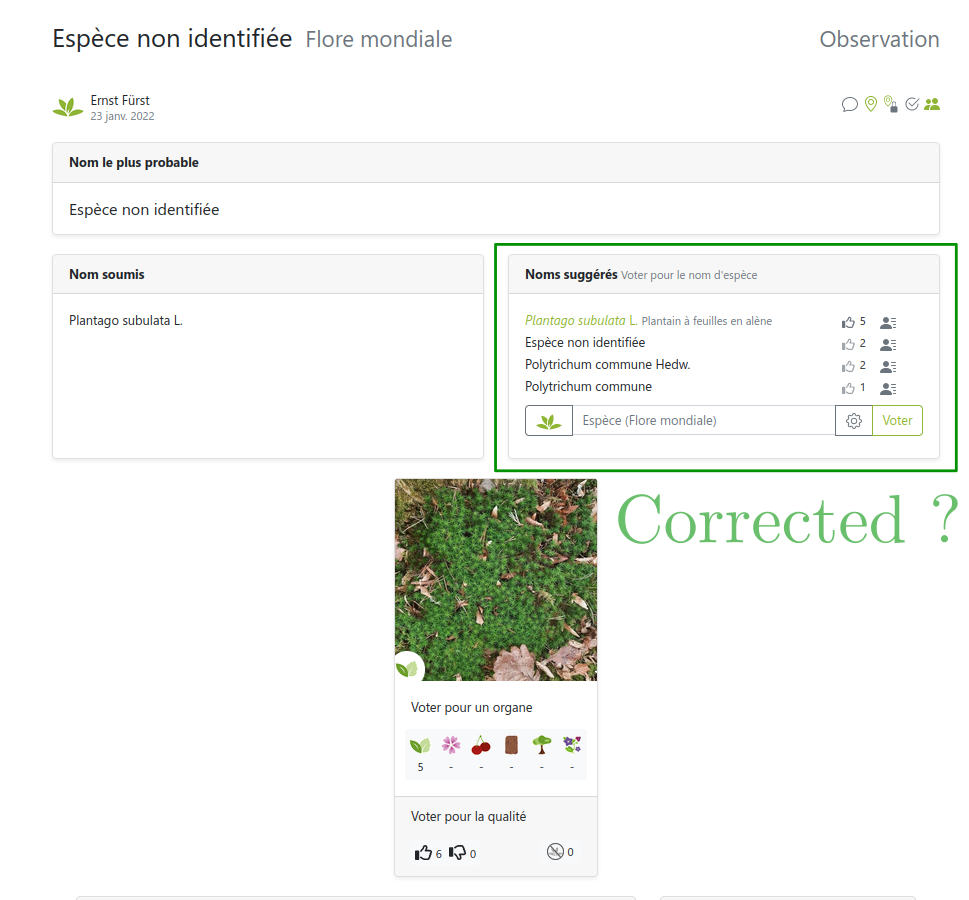
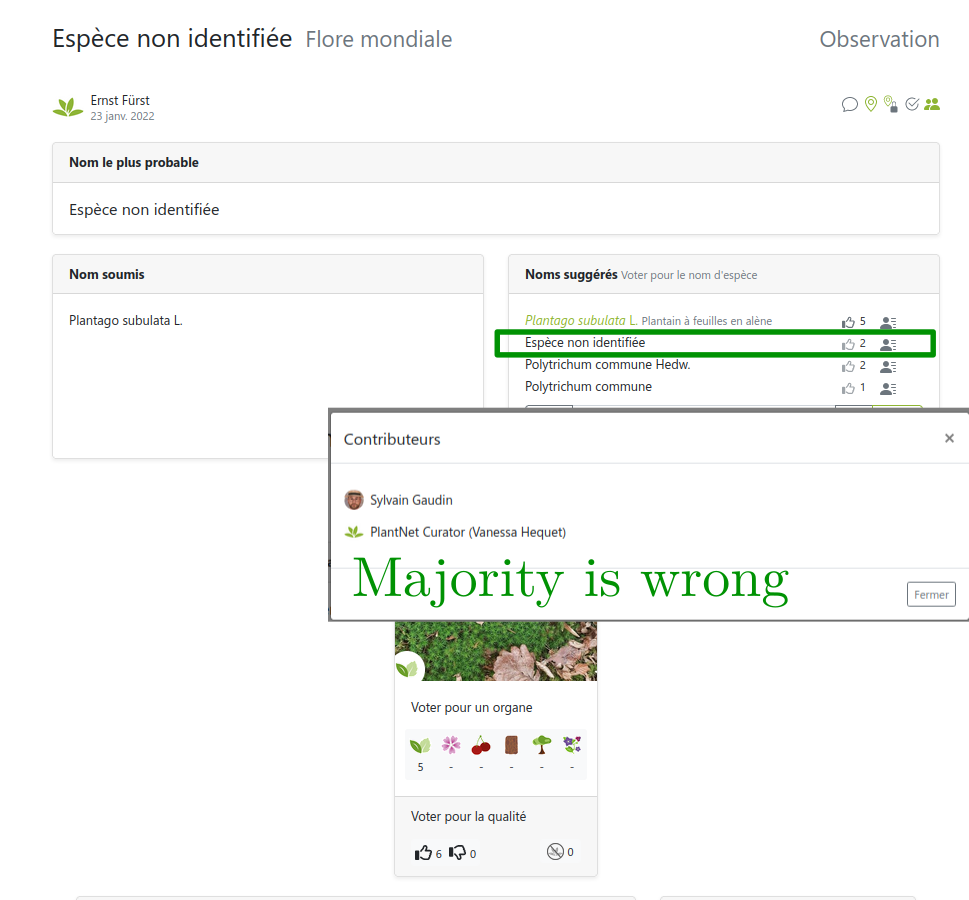
Link: https://identify.plantnet.org/weurope/observations/1012500059
The good, the bad and the ugly
- The good: fast, easy, cheap data collection
- The bad: noisy labels with different levels of expertise
- The ugly: (partly) missing theory, ad-hoc methods for noisy labels
(Weighted) Majority Vote
Objective
Provide for all images \(x_i\) an aggregated label \(\hat{y}_i\) based on the votes \(y^{u}_i\) of the workers \(u \in \mathcal{U}\).
Majority Vote (MV): intuitively
Naive idea: make users vote and take the most voted label for each image
Majority Vote : formally
Naive idea: make users vote and take the most voted label for each image
\[ \forall x_i \in \mathcal{X}_{\text{train}},\quad \hat y_i^{\text{MV}} = \mathop{\mathrm{arg\,max}}_{k\in [K]} \Big(\sum\limits_{u\in\mathcal{U}(x_i)} {1\hspace{-3.8pt} 1}_{\{y^{u}_i=k\}} \Big) \]
Properties:
✓ simple
✓ adapted for any number of users
✓ efficient, few labelers sufficient (say < 5, Snow et al. 2008)
✗ ineffective for borderline cases
✗ suffer from spammers / adversarial users
Constraints: wide range of skills, different levels of expertise
Modeling aspect: add a user weight to balance votes
Assume given weights \((w_u)_{u\in\mathcal{U}}\) for now
Weighted Majority Vote (WMV): example
The label confidence \(\mathrm{conf}_{i}(k)\) of label \(k\) for image \(x_i\) is the sum of the weights of the workers who voted for \(k\): \[ \forall k \in [K], \quad \mathrm{conf}_{i}(k) = \sum\limits_{u\in\mathcal{U}(x_i)} w_u {1\hspace{-3.8pt} 1}_{\{y^{u}_i=k\}} \]
Size effect:
- more votes \(\Rightarrow\) more confidence
- more expertise \(\Rightarrow\) more confidence
The label accuracy \(\mathrm{acc}_{i}(k)\) of label \(k\) for image \(x_i\) is the normalized sum of weights of the workers who voted for \(k\): \[ \forall k \in [K], \quad \mathrm{acc}_{i}(k) = \frac{\mathrm{conf}_i(k)}{\sum\limits_{k'\in [K]} \mathrm{conf}_i(k')} \]
Interpretation:
- only the proportion of the weights matters
Weighted Majority Vote (WMV)
Majority voting but weighted by a confidence score per user \(u\): \[ \forall x_i \in \mathcal{X}_{\texttt{train}},\quad \hat{y}_i^{\textrm{WMV}} = \mathop{\mathrm{arg\,max}}_{k\in [K]} \Big(\sum\limits_{u\in\mathcal{U}(x_i)} w_u {1\hspace{-3.8pt} 1}_{\{y^{u}_i=k\}} \Big) \]
Note: the weighted majority vote can be computed from confidence or accuracy \[ \hat{y}_i^{\textrm{WMV}} = \mathop{\mathrm{arg\,max}}_{k\in [K]} \Big( \mathrm{conf}_i(k) \Big) = \mathop{\mathrm{arg\,max}}_{k\in [K]} \Big(\mathrm{acc}_i(k) \Big) \]
Two pillars for validating a label \(\hat{y}_i\) for an image \(x_i\) in Pl@ntNet :
Expertise: labels quality check
keep images with label confidence above a threshold \(\theta_{\text{conf}}\), validate \(\hat{y}_i\) when \[ \boxed{\mathrm{conf}_{i}(\hat{y}_i) > \theta_{\text{conf}}} \]
Consensus: labels agreement check
keep images with label accuracy above a threshold \(\theta_{\text{acc}}\), validate \(\hat{y}_i\) when \[ \boxed{\mathrm{acc}_{i}(\hat{y}_i) > \theta_{\text{acc}}} \]
Pl@ntNet label aggregation
(EM algorithm)
Weighting scheme: weight user vote by its number of identified species
Weights example
- \(n_{\mathrm{user}} = 6\)
- \(K=3\) : Rosa indica, Ficus elastica, Mentha arvensis
- \(\theta_{\text{conf}}=2\) and \(\theta_{\text{acc}}=0.7\)
Take into account 4 users out of 6
Take into account 4 users out of 6
Invalidated label: Adding User 5 reduces accuracy
Label switched: User 6 is an expert (even self-validating)
Choice of weight function
\[ f(n_u) = n_u^\alpha - n_u^\beta + \gamma \text{ with } \begin{cases} \alpha = 0.5 \\ \beta=0.2 \\ \gamma=\log(1.7)\simeq 0.74 \end{cases} \]
Other existing strategies
- Majority Vote (MV)
Worker agreement with aggregate (WAWA): 2-step method
- Majority vote
- Weight users by how much they agree with the majority
- Weighted majority vote
- TwoThrid (iNaturalist)
- Need 2 votes
- \(2/3\) of agreements
Pl@ntNet labels release: South West. European flora
Extracting a subset of a Pl@ntNet votes
- South Western European flora observations since \(2017\)
- \(~800K\) users answered more than \(11K\) species
- \(~6.6M\) observations
- \(~9M\) votes casted
- Imbalance: 80% of observations are represented by 10% of total votes
No ground truth available to evaluate the strategies
Test sets without ground truth
- Extract \(98\) experts: Tela Botanica + prior knowledge (P. Bonnet)
Pl@ntNet South Western European flora
Accuracy and number of classes kept
- Pl@ntNet aggregation performs better overall
- TwoThird is highly impacted by the reject threshold
- In ambiguous settings, strategies weighting users are better
Performance: Precision, recall and validity
- Pl@ntNet aggregation performs better overall
- TwoThird has good precision but bad recall
- We indeed remove some data but less than TwoThird
Why?
- More data
- Could correct non-expert users
- Could invalidate bad quality observation
Main danger
- Model collapse (Shumailov et al. 2024): users are already guided by AI predictions
Potential strategies to integrate the AI vote
- AI as worker: naive integration
- AI fixed weight:
- weight fixed to \(1.7\)
- can invalidate two new users but is not self-validating
- AI invalidating:
- weight fixed to \(1.7\)
- can only invalidate observation
- AI confident:
- weight fixed to \(1.7\)
- can participate if confidence in prediction high enough (\(\theta_{\text{score}}\))
\(\Longrightarrow\) confident AI with \(\theta_{\text{score}}=0.7\) performs best… but invalidating AI could be preferred for safety \(\Longleftarrow\)
Aggregating labels: open source tool
peerannot: Python library to handle crowdsourced data

Conclusion
- Challenges in citizen science: many and varied (need more attention)
- Crowdsourcing / Label uncertainty: helpful for data curation
- Improved data quality \(\implies\) improved learning performance
Dataset release:
- Pl@ntNet-300K: https://zenodo.org/record/5645731
- Pl@ntNet SWE flora: https://zenodo.org/records/10782465
Code release:
- Toolbox: https://peerannot.github.io/
- Some benchmarks: https://benchopt.github.io/
Future work
- Uncertainty quantification
- Improve robustness to adversarial users
- Leverage gamification for more quality labels theplantgame.com

